Sponsor: Do you build complex software systems? See how NServiceBus makes it easier to design, build, and manage software systems that use message queues to achieve loose coupling. Get started for free.
Is your .NET application randomly crashing? In Production? Without any relevant application logs? You may be hitting a StackOverflowException if you see exception code 0xc00000fd in the event log. Here’s how to start troubleshooting StackOverflow Exceptions. 0xc00000fd First take a look in your event log. If you see a log similar to this:Faulting application name: MyApp.exe, version: 1.0.0.0, time stamp: 0xdfd8c80b Faulting module name: clr.dll, version: 4.7.2558.0, time stamp: 0x59d413ce Exception code: 0xc00000fdThe important part here is the exception code 0xc00000fd is a StackOverflowException.
Troubleshooting a .NET StackOverflowException
First thing I would recommend is looking for any recursion in your codebase. This is often likely the cause when you have unbounded recursion. It may not be obvious if you have data structures that play a role in your application and specifically where recursion exists.Debug Diagnostics Tool (DEBUGDIAG)
If you can’t determine where the StackOverflowException is occuring, first place to start is by downloading and installing the Debug Diagnostics Tool from Microsoft. https://www.microsoft.com/en-us/download/details.aspx?id=49924 Once installed, run the “DebugDaig 2 Collection” application. You will be immediately prompted with the following window: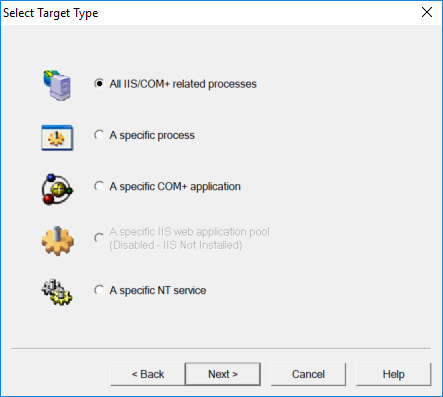 If you’re running ASP.NET 4.x you will likely be selecting IIS, select the first option. Otherwise, you likely are going to select a process or a NT Service (Windows Service).
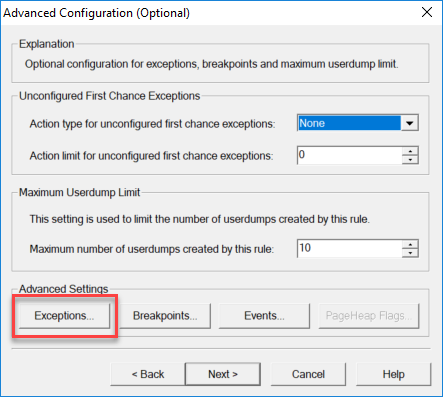
On the follow window, click the Exceptions button.
If you’re running ASP.NET 4.x you will likely be selecting IIS, select the first option. Otherwise, you likely are going to select a process or a NT Service (Windows Service).
On the follow window, click the Exceptions button.
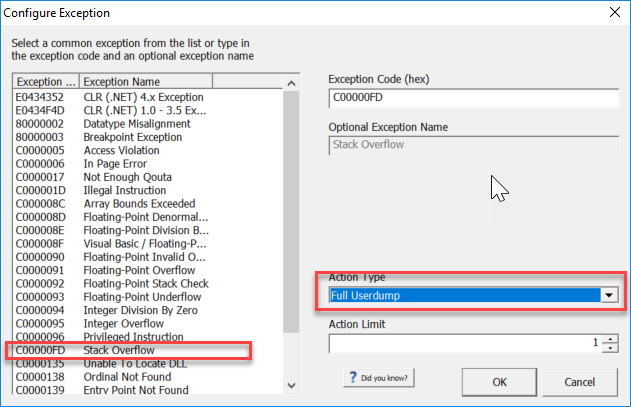
 From here we can specify to capture a StackOverflow exception. Change the Action Type to a Full userdump.
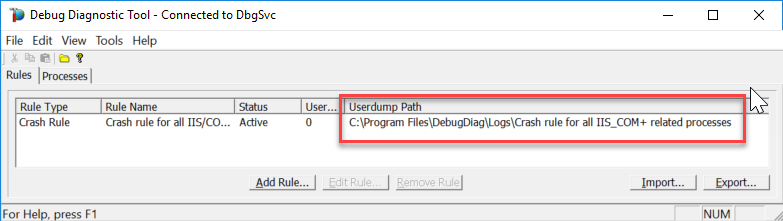
 Finally, click OK and Next to save the new Crash Rule.
Once your application hits a StackOverflowException and crashes, you will have a .dmp file in the rule folder.
Finally, click OK and Next to save the new Crash Rule.
Once your application hits a StackOverflowException and crashes, you will have a .dmp file in the rule folder.
WinDbg
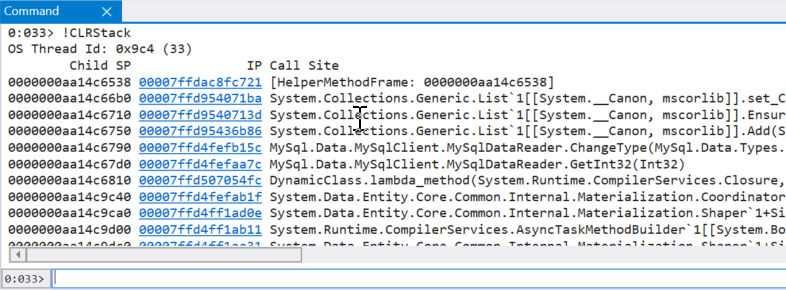
Once you have your memory dmp file, we are going to want to open it up with WinDbg. You have a couple options for installing. You can download Windows Driver Kit (WDK) which which require you to have latest Visual Studio with Desktop Development with C++ component installed. https://go.microsoft.com/fwlink/?linkid=873060 Another option is to download the the new WinDbg Preview from the Windows Store. This is a new version of WinDbg with a more modern look. Once you have WinDbg, whatever version, you can now type in .loadby sos clr in the Command input.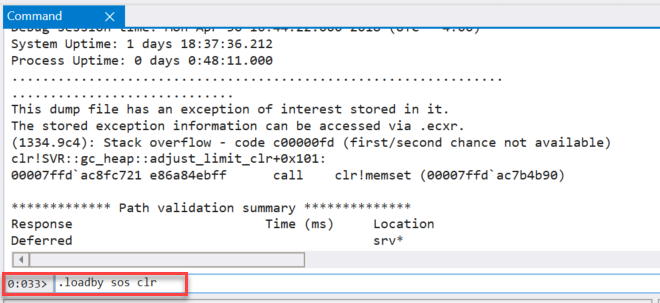 Followed by !CLRStack as the next command, which should then provide you with your .NET call stack.
 If you have any recommendations on WinDbg usage or other useful insights, please share them in the comments or on Twitter.